Your engine,
explained.
Enter your own lactate test, from a lab or a handheld meter, and Labthlete turns it into your thresholds, your training zones and a physics-based race plan. Add an aero and a durability test to sharpen it. Every number carries an honest band, the plus/minus range your data really supports, never a fake-precise guess.
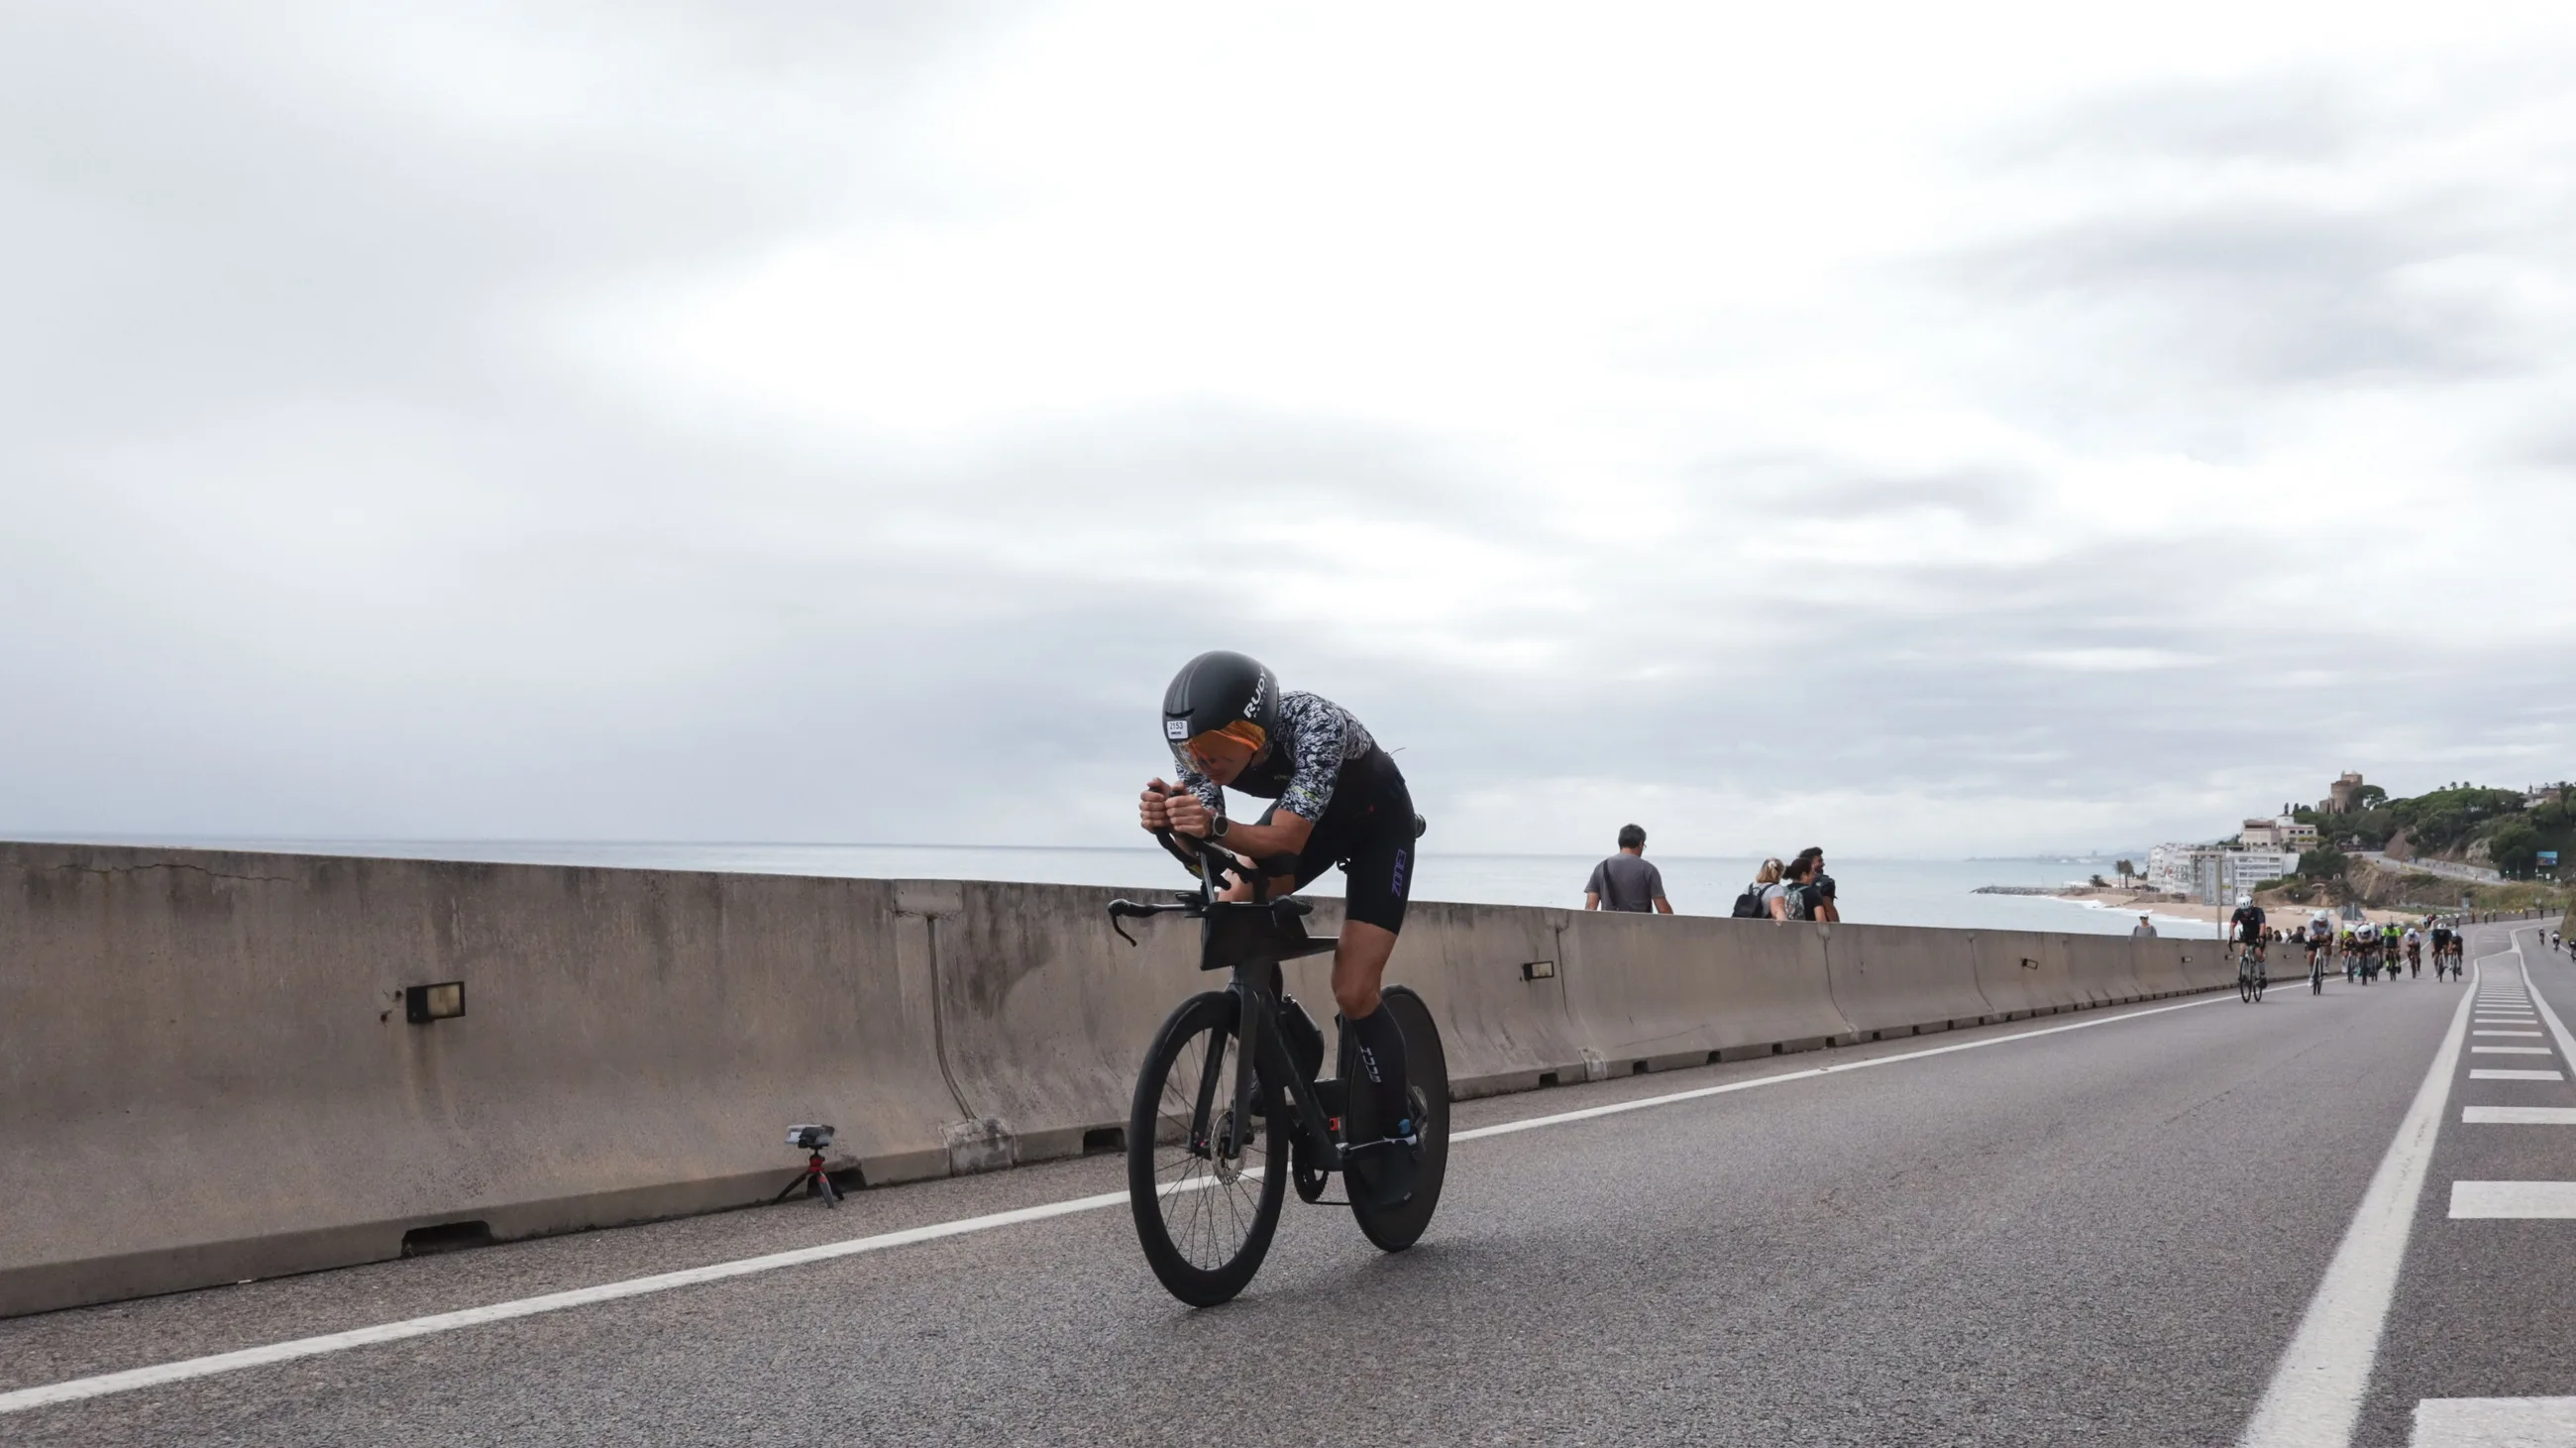
One real athlete, their numbers shown in the exact style you see inside the app: the engine it measured from their test, the race it planned. Keep scrolling for the real screens.
Do a lactate test at a lab, or prick a finger with your own meter and type in each step. The app reads the numbers you collect, it does not draw blood for you.
Your thresholds and zones straight away. Add a short aero ride and a durability field test and it measures your CdA and your fade too. Every value with its band.
A pacing plan for your course and distance, metre by metre, with an honest finish window instead of one fake-precise time.

You train harder than ever. Do you actually know what you can do on race day?
Watts, pace and heart rate tell you what you did. They do not tell you the fastest way to spend what you have over 180 km on the bike, or 42.2 on foot. That is a physics problem, and most tools guess at it from a number you typed in. We solve it from your measured lactate curve, and show you the uncertainty instead of hiding it.
One test. Your whole engine.
Enter your test, from a lab or your own handheld meter, and read your two lactate thresholds: LT1, your aerobic threshold, the top of easy all-day riding, and LT2, your anaerobic threshold, the highest effort you can hold at a stable lactate. Both in watts and in heart rate, with your training zones and, for runners, pace in min/km. Drag a threshold to fine-tune it; we pick a sensible detection method for you and power users can switch it.
Your aerodynamics, measured.
Your CdA, the aerodynamic drag that sets your speed at a given power, measured from a proper aero ride: power, stable conditions, a repeated loop or out-and-back. Compare any change, a position, a helmet, wheels, a skinsuit or tyres, each result with its band, and save the winner as a bike setup your race plan uses. Pick your test type; the roughest one only catches big changes, and we tell you so.
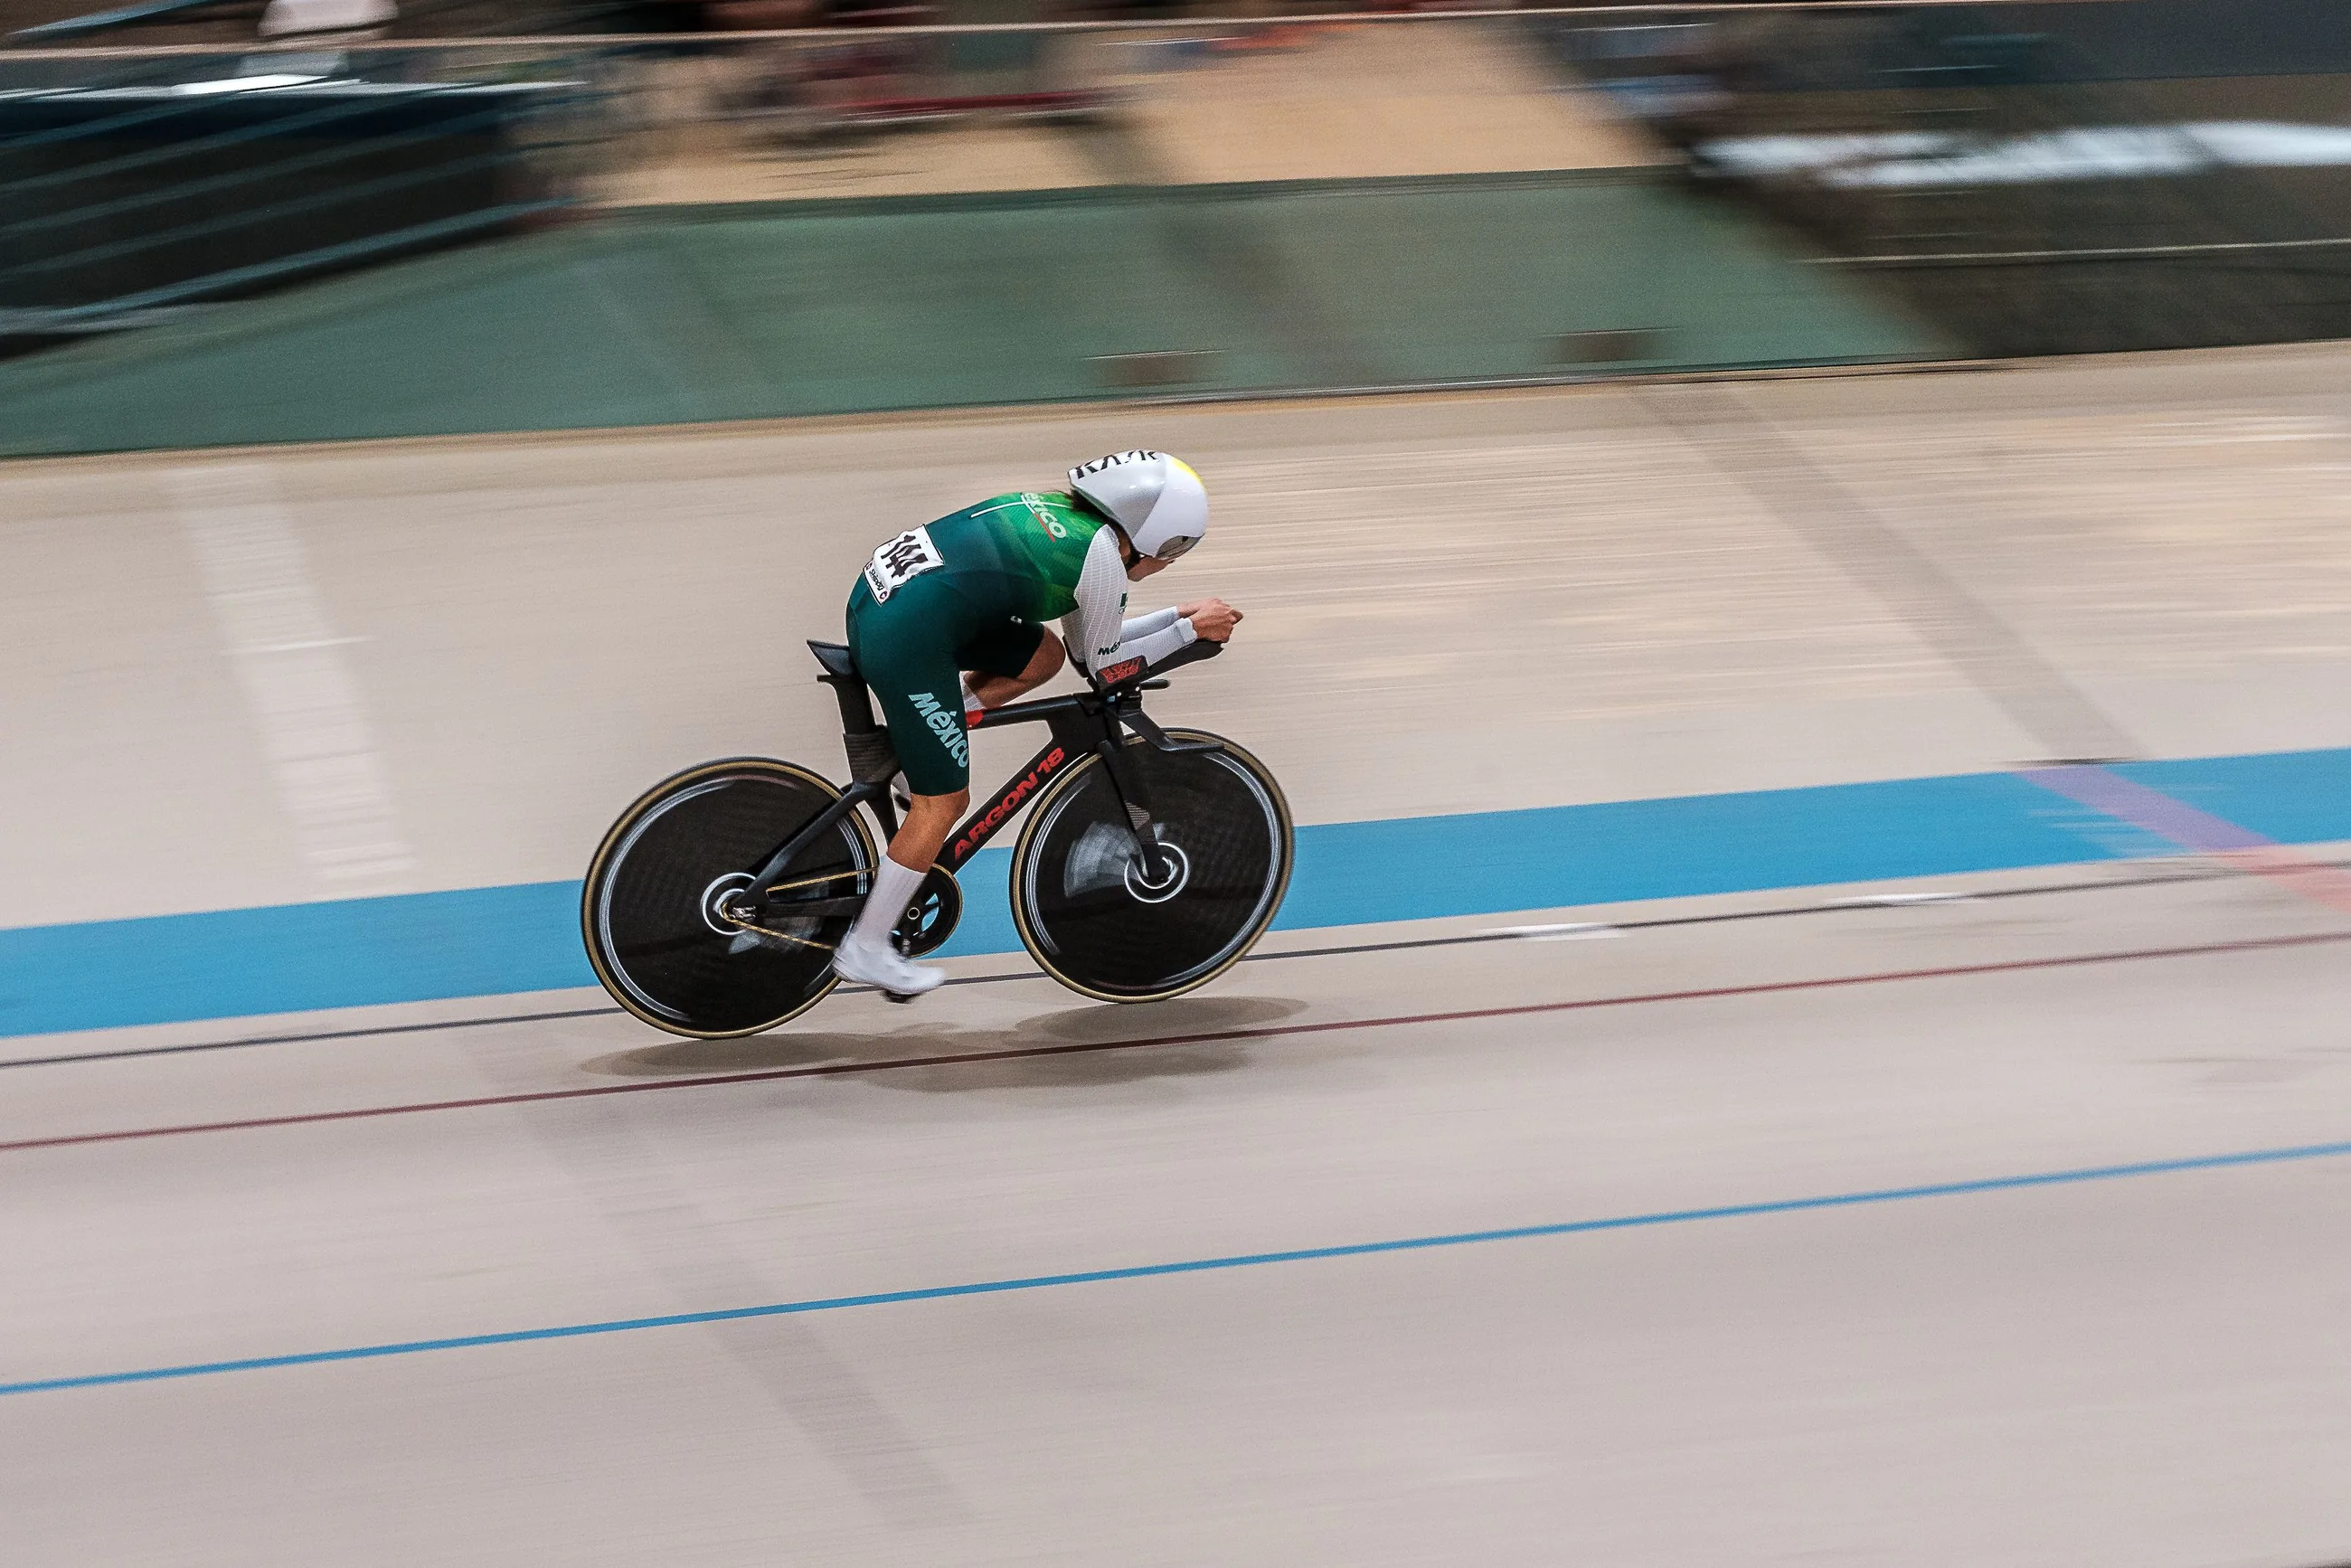
The signature band, exactly as the app draws it: the value, the interval it lives in, and the centre tick.
The band is the measurement.
The number that explains the last hour.
Your engine does not hold its ceiling for hours. Measured, this rider fades 1.8% for every 1,000 kJ of work, roughly 40 minutes of hard riding, better than a typical rider. So at the end of a 180 km bike they still hold 283 W where an average rider is down to 274. The pacing plan spends that fade in advance, so your reserve runs out at the line, not before.
Measure it two ways: a fresh lactate test against a pre-loaded one, or a 20 + 20 min field test. Saved to your profile, it feeds every prediction, and the pacing plan above spends your reserve against exactly this curve.
Your best race, computed metre by metre.
A full Ironman, swim to finish, on the real Ironman Barcelona course, simulated metre by metre from your measured engine and adjusted for heat and altitude. Where to push, where to save, an honest finish window instead of a fake-precise time. It works for any race and distance too, a road marathon, a 40 km time trial, a 70.3, a full Ironman. Barcelona is just the example here.
Every number traces back to the test.
No sliders guessed in the dark. Your thresholds come from your lactate curve, your aerodynamics from a CdA test, your durability from a field test; from those we set your zones and pacing. Change the engine and the whole race re-computes.
Not just triathlon. Your marathon, run-native.
The same engine, in min/km, on the real Boston course: the downhill start read as free speed, the Newton hills eased, grade-adjusted pace and a finish window. Your threshold pace comes from your lactate test, not a watts guess bolted onto running.
Where would you stand?
A database of 18,207 real race results, with your dot on the field. Pick a distance and a finish time, across every race of that distance or inside one edition, all years pooled or a single year.
Your whole squad, one lab.
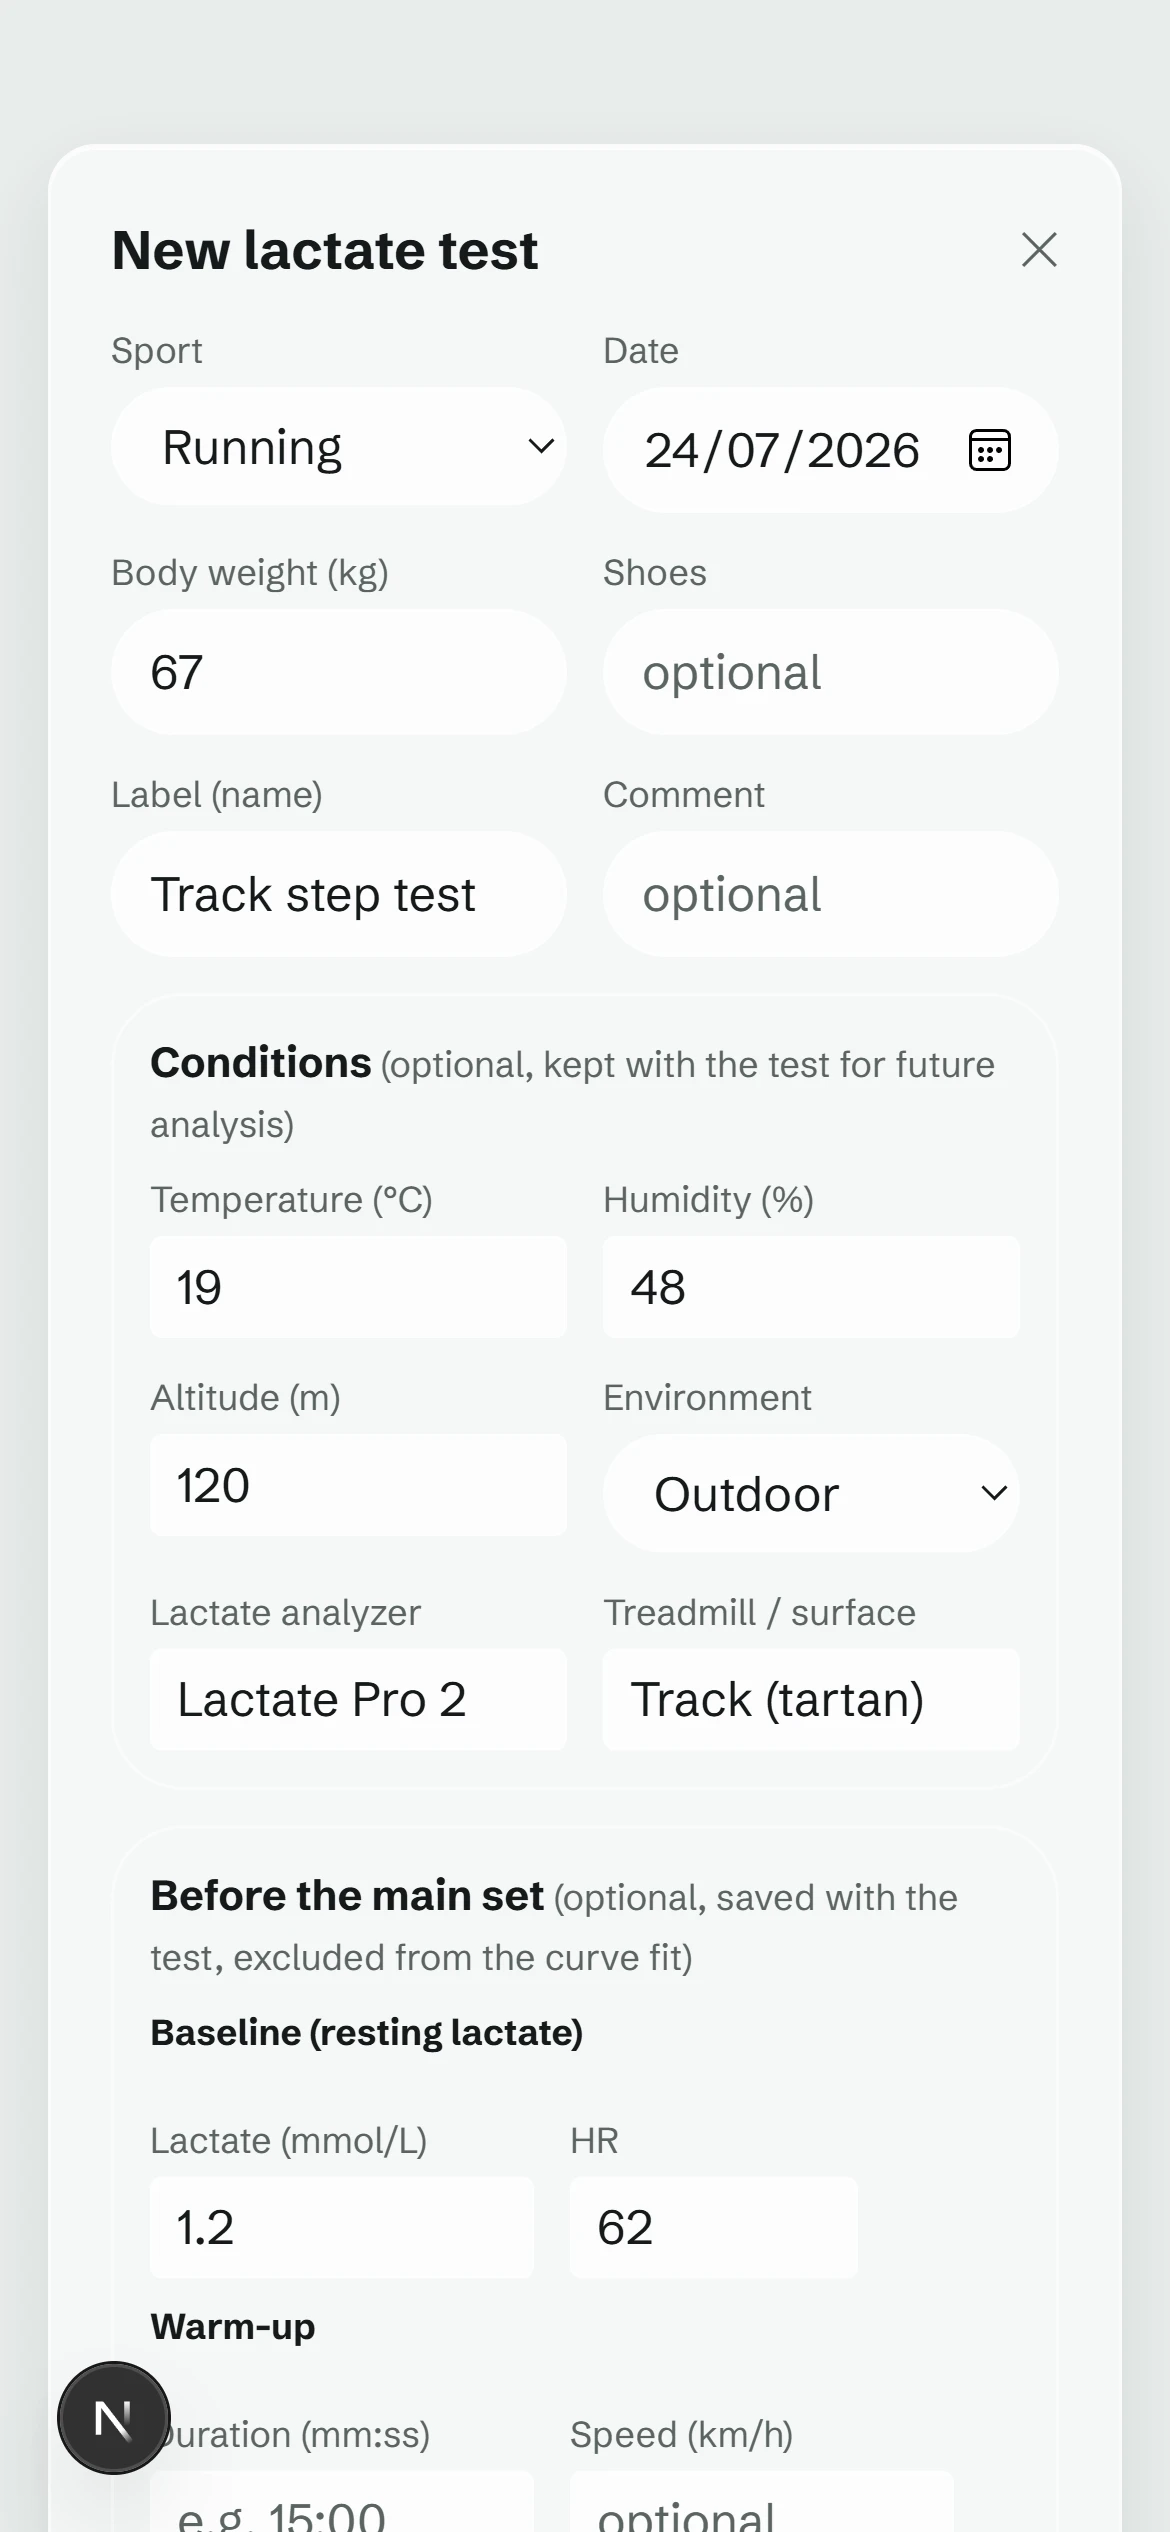
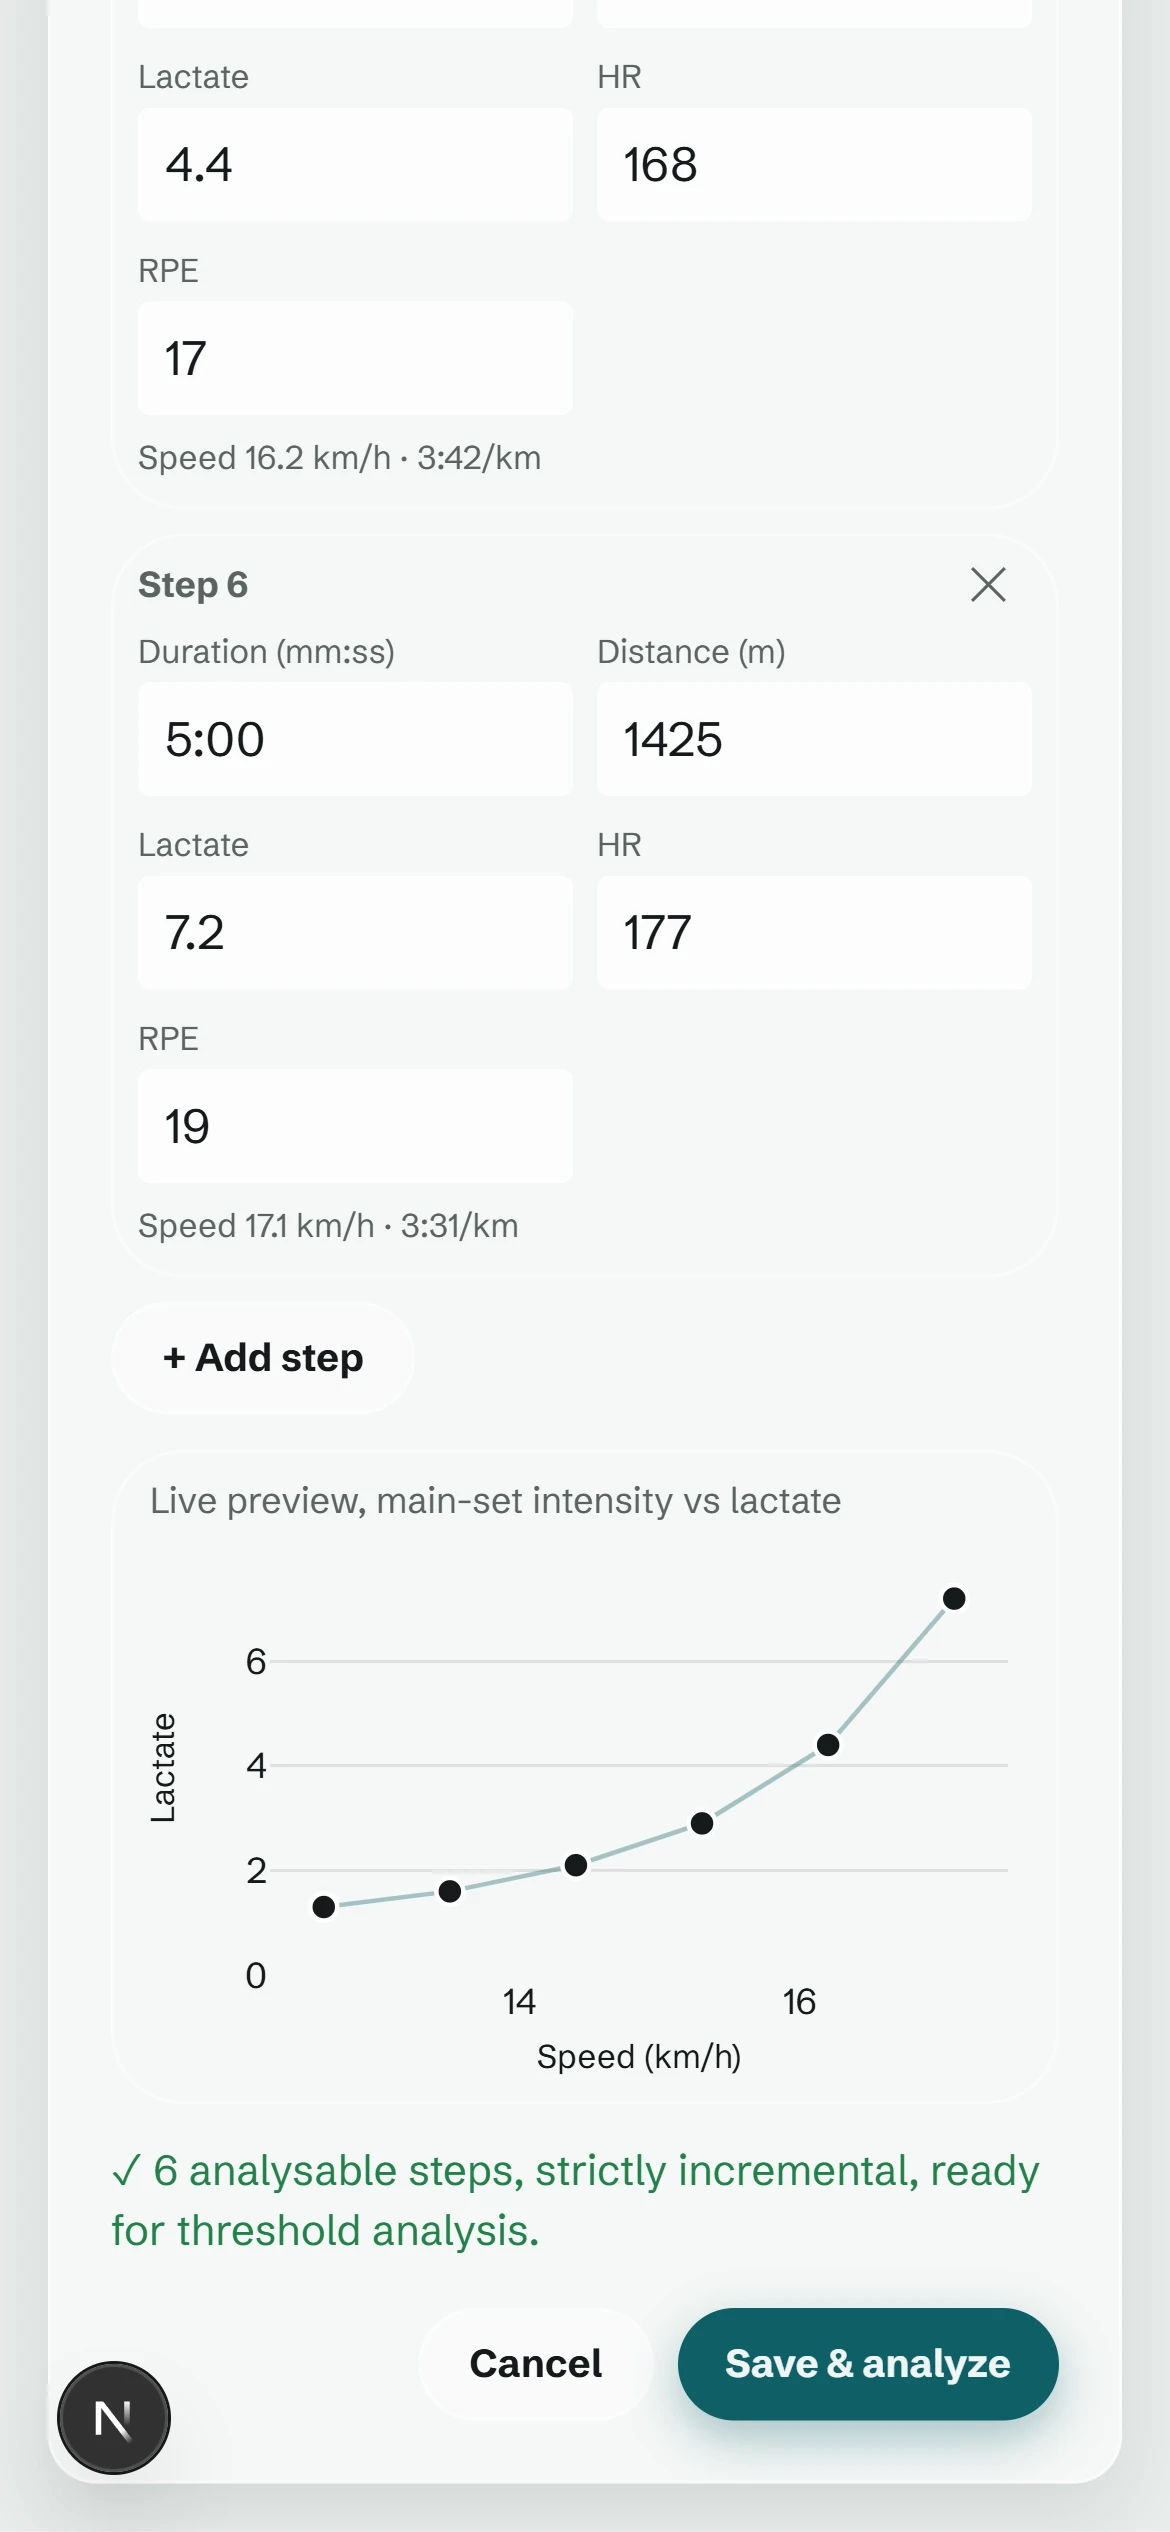
Log a lactate test from the side of the track while the athlete is still breathing hard: steps, pace computed for you, the curve drawing itself live, a validity check before you save. Import seasons of Excel history in one upload. Every athlete gets thresholds, zones, durability and a race plan.
When we cannot tell, we say so.
Within noise is an answer. When the interval crosses zero, the difference is smaller than what the test can detect. We say so, instead of selling you a number. This is the spine of the whole product.
The interval crosses zero: this difference is smaller than what today's test can detect.
A wide band is not a failure. It is the honest size of what this ride can prove.
Within noise: treat the two setups as equal until you retest.
See your engine in two minutes.
Sign up free, or try the live demo: no account, no test, just drag the sliders and watch the optimal plan rebuild live.